Analyze FiveM Performance with Profiler
Optimize your FiveM server by using the built-in profiler to detect CPU-intensive resources. This guide shows you how to record, analyze and interpret profiler data via Chrome DevTools to fix lag issues and improve your players' FPS.
Prerequisites
- Use the latest versions of FiveM artifacts (if optimizing resources)
- Have a server with txAdmin or a way to send commands (See our guide to configure txAdmin here)
- Use an up-to-date FiveM client (if optimizing FPS)
- Google Chrome (or another Chromium-based browser) to easily read the profiler (otherwise requires more manipulation)
- Keep the server or client running if you want to open the profiler directly in the browser without downloading
Usage
Command to capture a profiler
profiler record <total number of frames>
500 is the recommended total number of frames initially, but you can capture more or less depending on your needs.
A frame is not a second.
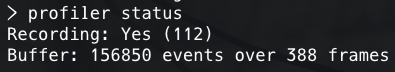
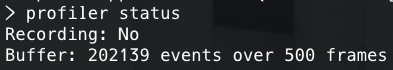
To verify that the profiler is properly running
See the following message in your server console
Started recording
Via the command
profiler status
Example output when the profiler is running:
Example output once the profiler is finished:
Open the profiler directly (Without having to save)
Use the following command:
profiler view
Then click the link that appears in your server console.
Your txAdmin must remain open without restarting for the profiler to display. (Otherwise you need to download the profiler)
It is always possible to perform the following steps to save the profiler even if you opened it.
You can also download it directly from the browser.
Save the profiler
Use the following command:
profiler saveJSON <filename>.json
Then download the file to your computer.
The file will be saved at the root of the server configured in txAdmin.
By default, on ElypseCloud, it is in the /home/container/ folder if you imported your database, otherwise
in a folder in /home/container/txData/XXX_XxxxxXXX/ where XXX_XxxxxXXX is the name of your txAdmin template.
View the profiler via Chrome
- Open a new tab in Chrome
- Open the developer console (F12 or Ctrl + Shift + I)
- Go to the
PerformancetabWhere is the Performance tab?If it's not visible, click "More tools" then "Performance" OR on the three dots in the top right of the developer console OR on ">>" and "Performance".
- Right-click anywhere
- Select "Import a profile" or "Load profile"
- Select the JSON file you downloaded previously
It is possible to increase the size of the window for better visualization of the profiler.
You must change from "Summary" to "Ascending" to see the time for each resource.
Yellow spikes

Yellow spikes represent a spike in CPU consumption.
It is possible to click a bit before, hold the click and move the mouse to the right after the yellow spike to concentrate the data on the area of interest.
View information
In the "Ascending" bar, you can see the consumption of each resource. (Here in the example, it's over a period of 500 frames)
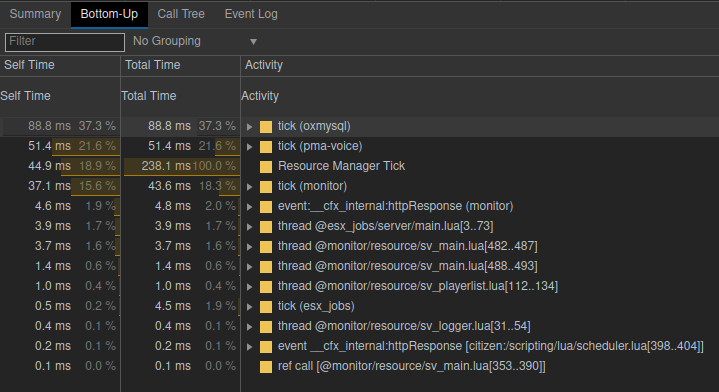
It is also possible to get the lines of code that consume the most resources.

oxmysql or mysql-async can consume a lot of CPU resources, but this is normal because they
are used by other resources. So it's normal to see them in the profiler at the top of the list.
If a duration is abnormally high, you need to check how the resource is used and if it uses correctly the resource in question.
🎉 You now have all the keys!
If you have any questions, visit our Discord.